From Payments to MRR
MRR is the lifeblood of a subscription service.
Monthly Recurring Revenue (MRR) is one of the most important metrics a Software as a Service company tracks. MRR represents the revenue that comes from charges that recur. Since the charges are recurring instead of once off, the company can make better predictions about how much money will be made in future.
As an example, a telecom company knows with higher certainty how much a customer on a contract will pay them in the coming months compared to a customer on a pay-as-you-go plan.
Investors (and CFOs, employees, and potential hires) will often look to MRR in order to gauge the success and long term viability of a startup because MRR represents stable revenue that is likely to continue (and hopefully grow).
In the following set of blog posts I will be going through how we track our MRR: From raw data collection, to cleaning, formatting, and eventually visualizing and displaying the information to the rest of the company.
Parts of this process may be unique to our business domain; however, we hope that this detailed analysis can help you implement similar tracking at your company.
We have broken up the explanation of our process into three parts:
- Part 1: The stack: Technology behind our flow of data
- Part 2: The calculations: Formatting and aggregating the raw data.
- Part 3: The process: How we respond to changes in the data
This blog post covers Part 1, with Parts 2 and 3 following shortly.
Gust offers resources and software to guide startups through the different phases of growth including a network to connect angel investors to startups, an equity management suite, and a platform for founders to start and run companies. Since each of these offerings can be viewed as a separate product, they necessitate individual analysis.
One of the early difficulties we faced was aggregating the data produced by each of these offerings. Each offering bills customers for their services in a slightly different way so we first needed a common format that subscriptions from the different products could follow. Out of the box analytics solutions lacked this flexibility so we had to calculate MRR using our own process.
The purpose of each of these products or services can be broken down into one of four goals:
- Collection
- Modification and aggregation
- Data access
- Visualization and dissemination
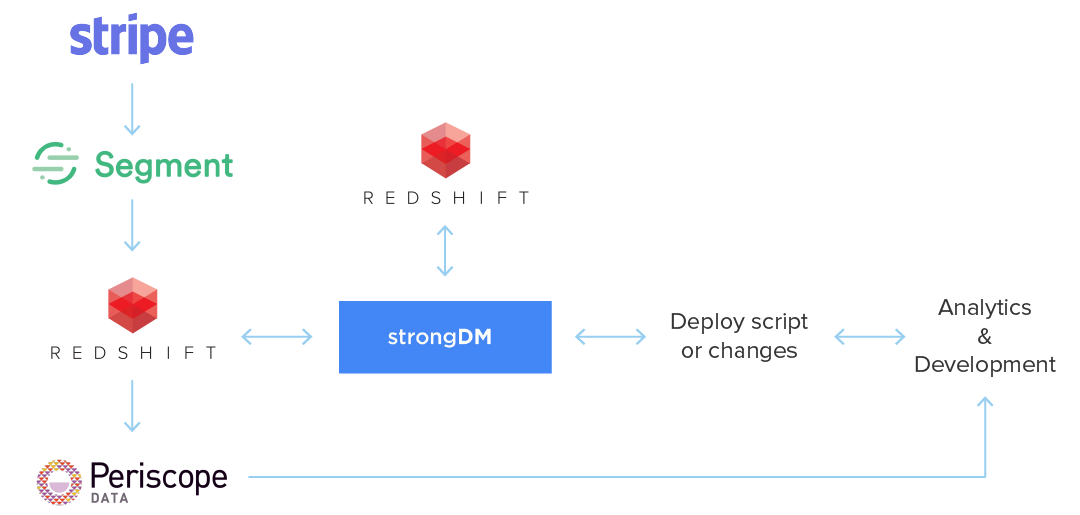
Collection
Any MRR calculation starts with a payment for a subscription service. We use Stripe to charge our customers, as well as to track which customers still have "active" subscriptions versus those that have cancelled or are overdue on payments.
Since Stripe handles our payments, this becomes our "source of truth": A customer isn’t truly a customer unless they are paying for our services, and they aren’t paying for our services unless Stripe has a record of the transaction.
Segment is an analytics aggregator that pulls in all of our data from the Stripe API. Segment has integrations with many services, so there’s no need for us to write the integrations ourselves when we want to get data from a source.
After Segment pulls in the data from Stripe, we need a location to store this information so we can access it at will. For this purpose we use Redshift database. We have two reasons for choosing a Redshift database: the database is easily scalable (we can increase the size and speed we need as we acquire more data) and Segment has a built in integration (Segment could transfer the raw data into the database without us needing to write any custom code).
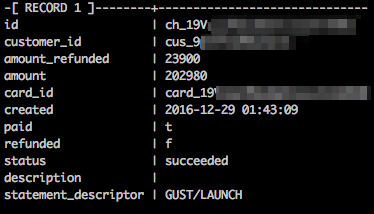
A sample charge for our startup creation and management platform Gust Launch can be seen below:
Modification and Aggregation
Even though Segment performs some ETL on the data and places it into a table format, the data is still not in a structure that easily allows us to calculate MRR. An ETL process takes raw data, makes changes to it like formatting, aggregating or calculations and then saves this new data (while keeping the raw data intact). Stripe and Segment can only provide us with raw purchase numbers; it's up to us to make them meaningful in terms of MRR.
This is where our own ETL process comes in. Ours takes the charges table in combination with other tables, such as subscriptions, refunds, and balance transactions, and applies the business logic required to calculate MRR. We use this logic to create a view"view" in our Redshift database that includes the information we want.
We chose to create Redshift views instead of tables as it allows us to access the most recent data without needing to worry about updating"refreshing" tables as new data comes in.
Unlike a regular database table, the data in a view is only pieced together from the "materialized" when it is called on and uses data already in other tables or views when we call on it.
Since the data in a view is materialized when it is called, it always has the most up to date information. This is in contrast to storing the information as tables, because the tables need to be updated as additional information flows in. The primary disadvantage of storing the data in views is that accessing the data is slower than it would be from a table, since they are materialized each time they are called.
We understood this tradeoff when we created the views. We found that with the size of our data it was worth spending extra time waiting for results instead of investing development time to keep tables up to date. However, as our data grows, the views get slower which may make it worthwhile to switch to tables instead.
An example of the results returned from one of our views:
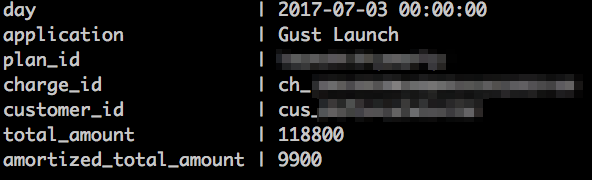
This view uses the data we saw in the first example, after we apply additional calculations to provide us with the necessary information for MRR. In this case, the customer paid upfront for a yearly plan, so as part of the view’s calculations it amortizes the payment so that only 1/12 of the total payment contributes to MRR in any month.
Data Access
In order to read the raw data and changes made during ETL, employees need database access. This is a two-step process. First they need to get access to the database itself, which in the case of Redshift means configuring the security group within AWS. The next step is accessing the data itself, which requires setting up a user with a username and password for each individual who wants access.
We use strongDM's proxy to manage database access. Instead of sharing sensitive credentials with every individual analyst, product manager, or engineer, we use strongDM to share temporary proxied access and monitor their queries. This makes it easy for DevOps to rotate keys and add new data sources without issuing new credentials or modifying the security settings on AWS daily.
We also use strongDM to manage permissions for service accounts like test databases. When our team needs to review the effects of changes made to the ETL code, we use strongDM to connect to a Redshift snapshot (an exact copy of the database from a specific point in time) rather than on the production database to see the effects of the changes there. If the ETL works as desired, we then connect back to the production database to run the ETL there.
More details about how we test and run our ETL process will be covered in part 3 of this blog series.
Data Visualization and Dissemination
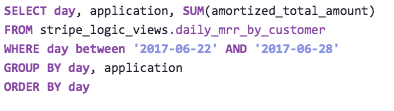
Once we have our views reporting correctly, we need some way to display the information meaningfully. We use Periscope Data as our visualization tool. Periscope connects directly to our Redshift database and has access to the views we created in the previous step.
Thanks to our database views, the queries required to calculate/display MRR are very simple. For instance, the query for calculating MRR on a particular day, segmented by which application is responsible is simply:
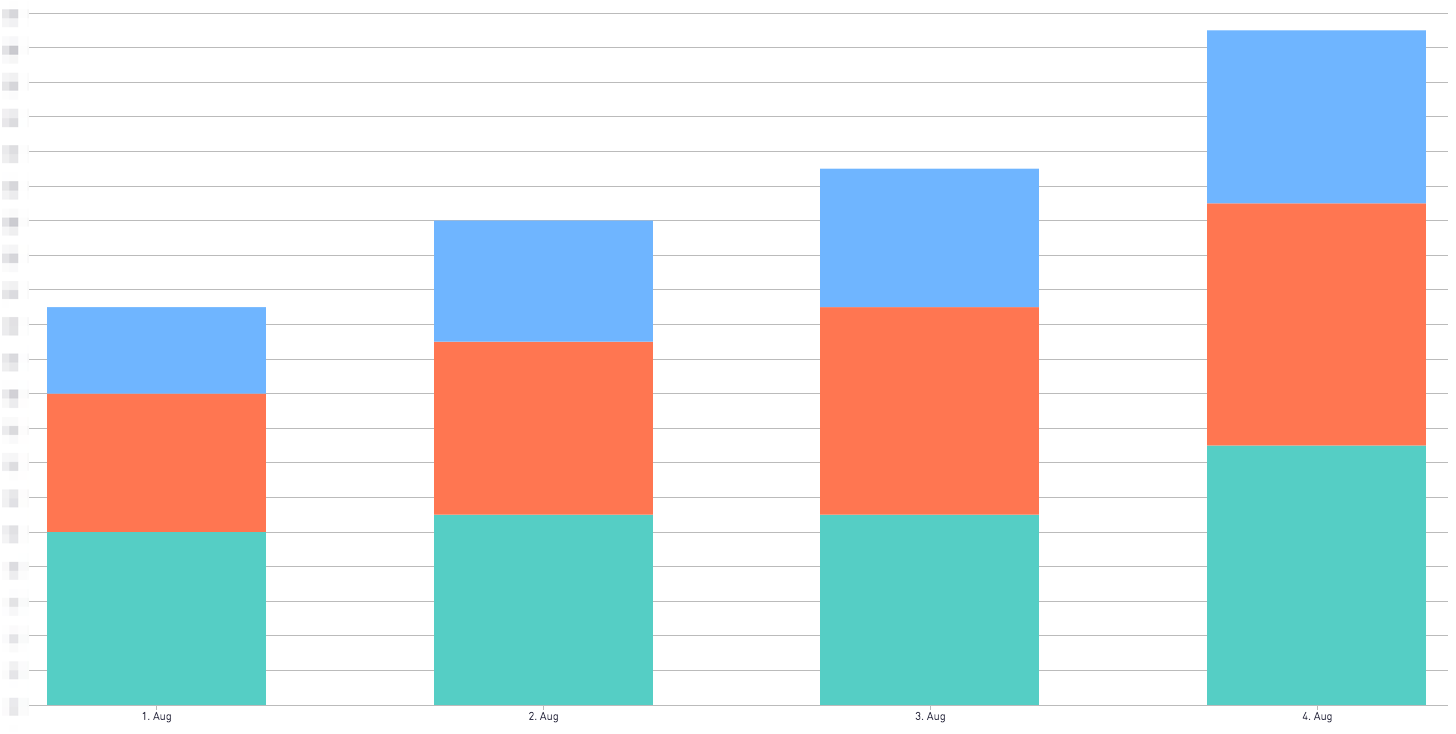
Every individual who needs access to our MRR total is given an account on Periscope Data. This allows them to look at the values and specify date ranges or products or a whole slew of other dimensions in order to help them make decisions.
We also have an open, company-wide meeting weekly where we discuss the work of the previous week. At each of these meetings we discuss our key metrics, including MRR. We send out the minutes of the meeting in a company wide email,ensuring that no one at Gust is in the dark about the current health of the business.
The next post in this series details the difficulties we faced trying to calculate MRR on a weekly basis. That post will detail the solutions we used to aggregate the data and how we deal with discounts, refunds and cancellations.
Data and Analytics at Gust
At Gust, we are working to support founders worldwide pursue their passions by removing roadblocks and providing easy solutions to common startup challenges. Our data analysts and engineers do the same for our own company.
We try to make our process as reusable as possible; we want our team to have the tools to answer questions themselves. Our strategy is to generalize the requests we get and build out flexible infrastructure, reports, and dashboards that can anticipate follow-on requests by offering intelligent filters and inputs to shape the data at hand. We spend our time working with other departments on those explorations as well as investing in our technology to be ready always for the next series of questions we could ask.